Weather Graphs for 2024-10-29
Wind Direction

Wind Speed
. For detailed information on this graph, go to the \"TODAY\" tab at the top of this page.") Wind Speed MPH
Wind Speed MPH  10 minute average Wind Speed
  Gusts over 2 Minutes Time
  Gust over 10 Minute Period
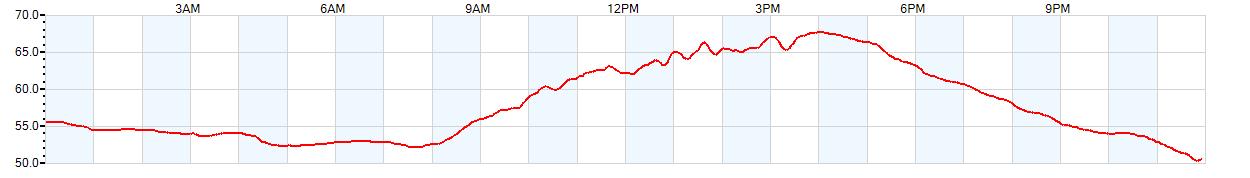
Temperature
Humidity

Daily Rain
 accumulated from midnight-to-midnight and since the beginning of the season, July 1st. For detailed information on this graph, go to the \"TODAY\" tab at the top of this page.")
Rain Rate

University Police wind advisory reference
For campus closure information please call the campus Emergency Hotline at (909) 537-5999
© All rights reserved. Unauthorized duplication or distribution is prohibited
Never base important decisions on this or any weather information obtained from the Internet
California State University, San Bernardino
5500 University Parkway, San Bernardino, CA. 92407
Phone: (909) 537-5108, Email: Weather Webmaster
Last Updated: